How to scale Kubernetes with any metrics using Kubernetes Event-driven Autoscaling (KEDA)
Scaling an Elastic stack in Kubernetes or any Kubernetes cluster can be a challenge if you don’t scale based on default scaling metrics such as CPU, Memory, or Storage. Luckily, Kubernetes has built-in support for Horizontal Pod Autoscaling (HPA) based on CPU and memory metrics. However, what if your cluster needs to scale based on other parameters? For example, how can we scale our cluster based on other key parameters like JVM heap size usage, or the count of pending tasks, or any other important metrics? Let’s explore this further.
Kubernetes Event-driven Autoscaling (KEDA)
From the perspective of Kubernetes, a general autoscaling approach can rely on basic metrics such as CPU usage or memory usage. However, this may not be sufficient for all types of applications. For instance, an application like Elastic Stack, whose primary behaviour varies based on the Java Virtual Memory (JVM), cannot be monitored solely based on system-level CPU or memory usage. The application may be experiencing memory shortages even if the memory usage at the system/pod level is low. As a result, Kubernetes HPA may be unaware of the situation and assume normal operations. Keep in mind that Elastic’s enterprise license includes autoscaling based on storage usage.
Kubernetes KEDA comes to the rescue. From their website,
KEDA is a single-purpose and lightweight component that can be added into any Kubernetes cluster. KEDA works alongside standard Kubernetes components like the Horizontal Pod Autoscaler and can extend functionality without overwriting or duplication.
KEDA is an incubating CNCF project which was accepted to CNCF on March 12, 2020. Read more about them here.
In this blog post, we will explore how to scale a sample application such as Elastic Stack based on metrics other than CPU, memory, or storage usage while maintaining its functionality and performance. The elastic stack recommends using Elastic Cloud Kubernetes (ECK) for kubernetes deployments which uses operator pattern which cannot use KEDA for auto scaling.
Architecture
To begin, it’s advisable to start with a diagram. The image below provides an example of a Kubernetes cluster setup for Elastic Stack. Please note that the cluster diagram does not include namespace separation. Instead, the node separation represents deployments/statefulsets for the HPA to act on. Additionally, the handling of secrets is not represented in the diagram.
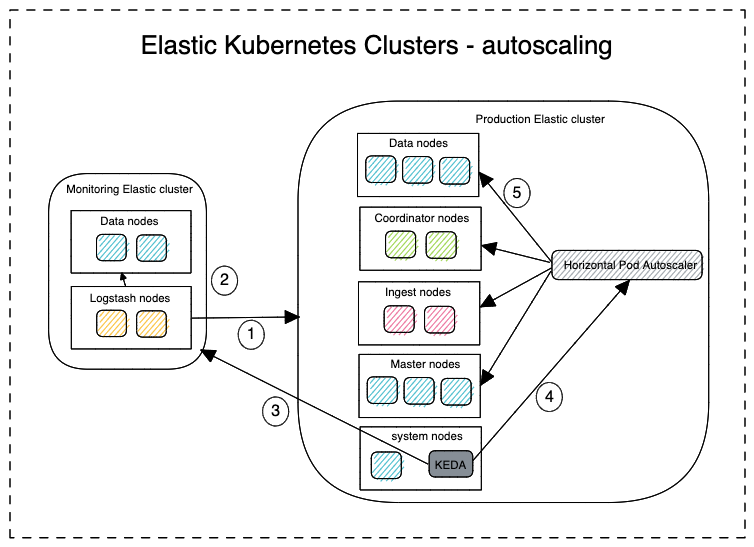
The figure above depicts two Kubernetes clusters: one running production workloads and the other, a dedicated monitoring cluster in accordance with the official recommendation for Elastic Stack. Alternatively, these components can exist within a single Kubernetes cluster separated by namespaces for a simpler architecture. The purpose of a dedicated monitoring cluster is to ensure the ability to perform troubleshooting in case the production cluster is not operational or is inaccessible. All metrics and data about the production cluster are stored in this monitoring cluster.
To set up an elastic cluster using KEDA, you must first install and configure it. Once successfully installed and configured on the cluster that needs to be scaled, follow the workflow below to see it in action:
- Logstash component in the monitoring cluster pulls the necessary metrics from the production cluster at regular intervals.
- Logstash component stores these retrieved metrics in the correct format into the Elasticsearch database of the monitoring cluster.
- KEDA polls at regular intervals for specific queries from the monitoring cluster.
- Soon after it discovers a discrepancy, KEDA performs the necessary action either to scale out or scale in and notifies the Horizontal Pod Autoscaler (HPA).
- After this, the Kubernetes HPA performs the actual scale out or scale in.
Configuring KEDA
1. Choosing the correct metric
This section outlines the metric that will be used as the basis for scaling. To monitor this metric, we will require a method for fetching it into our monitoring cluster. To achieve this, I have chosen to implement a Logstash component that will fetch the metric from the production cluster. It is important to note that this component can be substituted with any agent capable of scraping metrics. For the purpose of this example, we will examine the node stats API, which has the following syntax: GET /_nodes/<node_id>/stats/<metric>. By replacing node_id with the ID of an ingress node and metric with jvm, we can collect the necessary data into our monitoring cluster for further analysis. This same process can be repeated for many other metrics across nodes.
2. Elasticsearch search template
A search template in Elasticsearch is a pre-defined search query that can be executed with different parameters. In this case, it specifies the saved search criteria for the metric. The search results should be optimised based on the scaling requirements. KEDA runs this search on the monitoring cluster at regular intervals to determine if any actions need to be taken. For detailed instructions on how to create a search template, please consult the Elasticsearch guide.
3. Install KEDA and define the ScaledObject
KEDA deploys into a Kubernetes cluster using the operator model. If a helm chart is used, the deployment process is straightforward. Other options are available as well. Once the operator is deployed, a ScaledObject must be created to define the criteria, parameters, credentials, and other necessary details. A TriggerAuthentication is also required to connect the cluster and enable scaling.
Scaling in action: Java Virtual Memory threads count metric
Let’s consider the JVM threads count metric on an ingest node as an example and scale the cluster based on this metric. When the JVM thread count on the ingest node surpasses a certain value, the cluster will scale accordingly. It’s important to note that in practice, this could be any metric.
Assumptions
Lets say that you have a working production and monitoring Elastic cluster and KEDA installed, and let’s have the following assumptions:
| Item | Value |
|---|---|
| Production endpoint | prodelastic.com |
| Monitoring endpoint | monitorelastic.com |
| Credentials | elastic/elastic123 |
Step 1: JVM metric structure in the monitoring cluster
Lets take a look at the JVM metric. This is the JVM usage level from the production cluster. But those values are stored in the monitoring cluster. This is performed by url: GET _nodes/<nodename>/stats/jvm against node es01
curl -u elastic:elatic123 'https://prodelastic.com:9200/_nodes/es01/stats/jvm?pretty'
Produces output:
{
  "_nodes" : {
    "total" : 1,
    "successful" : 1,
    "failed" : 0
  },
  "cluster_name" : "prod-cluster",
  "nodes" : {
    "aDLDdo3aQXqUmEYMZ3Axyw" : {
      "timestamp" : 1682062177795,
      "name" : "es01",
   ...
      "jvm" : {
        "timestamp" : 1682062177795,
        "uptime_in_millis" : 138913,
        "threads" : {
          "count" : 72,
          "peak_count" : 75
        },
        ...
      }
    }
  }
}
Step 2: Create the search template in the monitoring cluster
Once we have identified the metric to monitor, the next step is to prepare the Elasticsearch search template. Let’s name this template jvmmetricscaling-template and apply it to the monitoring cluster, specifying the date range and thread count parameters. Keep in mind that the date and count parameters can be passed into the template from outside sources.
curl -XPUT -H 'Content-Type: application/json' -u elastic:test123 'https://monitorelastic.com:9200/_scripts/jvmmetricscaling-template?pretty' -d'
{
  "script": {
    "lang": "mustache",
    "source": {
      "query": {
        "bool": {
          "must": [
            {
              "range": {
                "timestamp": {
                  "gte": "{{date.min}}",
                  "lte": "{{date.max}}",
                  "format": "{{#join delimiter=\'||\'}}date.formats{{/join delimiter=\'||\'}}"
                }
              }
            },
            {
              "range": {
                "nodes.aDLDdo3aQXqUmEYMZ3Axyw.jvm.thread.count": {
                  "gte": "{{count}}"
                }
              }
            }
          ]
        }
      }
    }
  }
}
'
Produces output:
{
  "acknowledged" : true
}
Step 3: Run a test query to the template with parameter values
Let’s query the template with the thread count above 75 in last 1 minute. Let’s assume the index name to be prod_node_stats where these metrics are stored.
curl -k -XGET -H 'Content-Type: application/json' -u elastic:test123 'https://monitorelastic:9200/prod_node_stats/_search/template?pretty' -d'
{
  "id":"jvmmetricscaling-template",
  "params": {
    "date": {
      "min": "now-1m",
      "max": "now",
      "formats": ["yyyyMMddHHmmss"]
    },
    "nodes.aDLDdo3aQXqUmEYMZ3Axyw.jvm.thread.count": 75
  }
}
'
Produces output:
{
  "took" : 1,
  "timed_out" : false,
  "_shards" : {
    "total" : 1,
    "successful" : 1,
    "skipped" : 0,
    "failed" : 0
  },
  "hits" : {
    "total" : {
      "value" : 0,
      "relation" : "eq"
    },
    "max_score" : null,
    "hits" : [ ]
  }
}
We received 0 hits because the cluster is having a normal thread count. If we set the threads value lower, then we will see entries.
Step 4: Activate/Configure the ScaledObject to trigger the scale-out
Update the scaleObject resource in the cluster to scale if the search count hits at least 1
apiVersion: keda.sh/v1alpha1
kind: ScaledObject
metadata:
  name: jvmmetricscaling-scaledobject
spec:
  scaleTargetRef:
    name: "elasticsearch-ingest"
  triggers:
    - type: elasticsearch
      metadata:
        addresses: "http://monitorelastic:9200"
        username: "elastic"
        index: "prod_node_stats"
        searchTemplateName: "jvmmetricscaling-template"
        valueLocation: "hits.total.value"
        targetValue: "0"
        activationTargetValue: "1"
      authenticationRef:
        name: keda-trigger-auth-elasticsearch-secret
The KEDA has now been set up within the production cluster to scale based on the number of JVM threads. Note that the values in the saved search can be tuned based on the needs.
Drawbacks
- Complexity in setting up - As we can see setting up and debugging a Kubernetes cluster with KEDA deployed is not trivial. However, while autoscaling is available in the cloud, it is still not yet a fully mature concept. We expect this to become simpler in the future.
- Does not work with ECK - Elastic officially recommends Elastic Cloud Kubernetes (ECK) for kubernetes deployments of elastic stack in the cloud and on-premise environments. This uses operator pattern which controls the stateful sets of the elastic nodes (pods). Due to this, autoscaling by KEDA is limited by the elastic operator running inside the kubernetes cluster.
Conclusions
This blog post is about setting up autoscaling in a Kubernetes cluster with Kubernetes Event-driven Autoscaling (KEDA). Autoscaling is a very flexible and powerful tool as it can scale based on granular parameters. This allows for a more efficient and cost-effective use of resources. In this post, we explored how to set up autoscaling with KEDA, which can be quite challenging, and we also learned that debugging can be a difficult task. However, it is important to note that the potential benefits of autoscaling make the effort worth it.
Moreover, the Kubernetes built-in autoscaler has the capability to scale based on CPU and memory usage, but it would be beneficial if it could expand its capabilities to other system/process parameters. This would allow for more efficient and comprehensive autoscaling. While this feature is not currently available, it is something that the Kubernetes community might prioritise and we can expect to see it in the future.
References
- CNCF - KEDA project
- Kubernetes operator pattern
- Cluster node stats api documentation
- Elasticsearch search template
- KEDA deployment
- KEDA scaledObject, TriggerAuthentication
If you any questions, or you’d like any help with Kubernetes please get in touch!