In this blog post we will take a look at Steampipe, starting with some basics and then getting into more practical examples. We’ll be querying a Kubernetes cluster with Steampipe and then building a dashboard out of our queries that can be shared amongst colleagues or even publicly in the Steampipe hub.
What is Steampipe?#
Steampipe is an open source tool that can be used to query all kinds of APIs using an unified language for the queries; SQL. The core purpose of a tool like Steampipe is to answer questions. These questions might be related to compliance, security, cloud costs or operations. When operating in a cloud environment a lot of questions can be answered by querying the API, and with Steampipe we can use a unified language (SQL) to make those queries without worrying about the underlying APIs and their differences.
Querying APIs with SQL - What? How?#
Steampipe uses PostgreSQL Foreign Data Wrappers under the hood to grab data from various APIs/other sources and store it in an embedded Postgres database. Steampipe uses plugins to provide support for the various sources, and at the time of writing there are over 100 plugins available for various services (LDAP, DNS etc.), types of files (CSV, JSON etc.) and APIs. But as a user of the tool, you don’t really need to know what goes under the hood, but it sure feels a bit like magic writing an SQL query against the Kubernetes API which we will get into next.
Practical Introduction to Steampipe#
Let’s roll up our sleeves and write some SQL to learn more about the tool! To follow along with these steps, spin up a local Kubernetes cluster using tool such as k3d, kind or minikube. Or spin up a cluster in your favourite cloud, it does not matter what kind of a cluster it is to follow along.
Setting up Steampipe#
First things first, we must install steampipe. Follow the official documentation for your operating system: https://steampipe.io/downloads
After installing the CLI, install also the Kubernetes plugin:
1steampipe plugin install kubernetes
First Query#
Now you can start querying your cluster. You can run the following command to enter an interactive session within your terminal:
1steampipe query
Try running a query, for example:
1select name, namespace from kubernetes_pod;
Note that the first query might take a while to run when steampipe has to initialise the database. In my kind cluster this returns a following result:
 1+----------------------------------------------------+--------------------+
 2| name                                               | namespace          |
 3+----------------------------------------------------+--------------------+
 4| coredns-5d78c9869d-2q9pl                           | kube-system        |
 5| kube-controller-manager-kind-cluster-control-plane | kube-system        |
 6| envoy-ngv2z                                        | projectcontour     |
 7| kube-proxy-jqr75                                   | kube-system        |
 8| coredns-5d78c9869d-t286f                           | kube-system        |
 9| kube-apiserver-kind-cluster-control-plane          | kube-system        |
10| etcd-kind-cluster-control-plane                    | kube-system        |
11| local-path-provisioner-6bc4bddd6b-kqr22            | local-path-storage |
12| contour-d8c6f457f-h4skq                            | projectcontour     |
13| contour-d8c6f457f-nj5qh                            | projectcontour     |
14| kube-scheduler-kind-cluster-control-plane          | kube-system        |
15| kindnet-gszzf                                      | kube-system        |
16| contour-certgen-v1.24.2-zfnhj                      | projectcontour     |
17+----------------------------------------------------+--------------------+
Another useful command is .inspect which is one the steampipe meta-commands, it lists all the columns and their types and description:
 1> .inspect kubernetes_pod
 2+----------------------------------+--------------------------+-------------------------------------------------------------------------------+
 3| column                           | type                     | description                                                                   |
 4+----------------------------------+--------------------------+-------------------------------------------------------------------------------+
 5| _ctx                             | jsonb                    | Steampipe context in JSON form, e.g. connection_name.                         |
 6| active_deadline_seconds          | text                     | Optional duration in seconds the pod may be active on the node relative to St |
 7|                                  |                          | artTime before the system will actively try to mark it failed and kill associ |
 8|                                  |                          | ated containers.                                                              |
 9| affinity                         | jsonb                    | If specified, the pod's scheduling constraints.
10...
You can also run queries without entering the interactive mode, for example:
1steampipe query "select name, namespace from kubernetes_pod;"
Asking Questions#
As stated previously, the core purpose of a tool like Steampipe is to answer questions. Let’s come up with an example question and then use Steampipe to provide the answer.
A while back the Kubernetes project announced that they are deprecating the k8s.gcr.io registry in favour of registry.k8s.io, you can read more about this change from these links:
- https://kubernetes.io/blog/2022/11/28/registry-k8s-io-faster-cheaper-ga/
- https://kubernetes.io/blog/2023/03/10/image-registry-redirect/
Let’s use this announcement as an example to form a question; is my cluster affected by this change upstream? Or in other words; is the k8s.gcr.io registry used in my cluster?
Let’s deploy one of the example applications provided by the Kubernetes project itself that uses images from the registry we’re interested in:
1git clone https://github.com/kubernetes/examples.git
2cd examples
First, let’s checkout an old commit where the images are still pulled from k8s.gcr.io, which has been changed in the current HEAD:
1git checkout 4d12a8ba1b8e219069ece32a9d804885f6dcc56c
Second, let’s apply this to a new namespace in the cluster:
1kubectl create namespace guestbook
2kubectl apply -f guestbook-go/ -n guestbook
3kubectl get pods -n guestbook
Third, let’s see if we can find any pods using the legacy registry now in the cluster:
1steampipe query "select name, namespace, c ->> 'image' as image from kubernetes_pod, jsonb_array_elements(containers) as c where c ->> 'image' like 'k8s.gcr.io/%'"
We should see some results, but looking at the results in our terminal isn’t always the ideal way of digesting information, especially if we haven’t authored the query. Luckily Steampipe has a lot more tricks up it’s sleeve to turn the query results into something easier to digest at a glance. Next, we will take a peak at one of the key features of Steampipe, at least in my opinion, dashboards!
Building a Dashboard#
Dashboards are written in text files using the HashiCorp Configuration Language (HCL). This makes it really easy to go from a query into a visual presentation that can be shared amongst the organisation. Let’s take the earlier queries and create a small dashboard out of them.
First Dashboard#
Before creating the dashboard we will have to initialize a new Steampipe mod, mods are a way to package a collection of Steampipe queries/dashboards etc. to a package that can be shared, for example in Steampipe hub.
First we create an empty directory and then initialize the mod inside of the directory:
1mkdir k8s-dashboard
2cd k8s-dashboard
3steampipe mod init
This will create a mod.sp file that looks like this:
1mod "local" {
2  title = "k8s-dashboard"
3}
Now we can move on to actually creating the dashboard. First, let’s create a dashboard resource in an empty file:
1dashboard "k8s_dashboard" {
2  title = "Awesome Kubernetes Dashboard"
3
4  tags = {
5    type = "Dashboard"
6  }
7}
Now before even running this, let’s add our first query which will show a card in the dashboard. Let’s use the query from earlier to list pods in all namespaces, but we will modify the SELECT statement a bit so that Steampipe knows how to interpret the query results:
 1dashboard "k8s_dashboard" {
 2  title = "Awesome Kubernetes Dashboard"
 3
 4  tags = {
 5    type = "Dashboard"
 6  }
 7
 8  card {
 9    sql = <<-EOQ
10      select
11        count(name) as value,
12        'Number of Pods' as label
13      from
14        kubernetes_pod;
15    EOQ
16    width = 3
17  }
18}
Now we can run a command to open up the dashboard in our browser:
1steampipe dashboard
After running the command, Steampipe will try to open your default browser. Click on the link of the dashboard and you will see the card there:
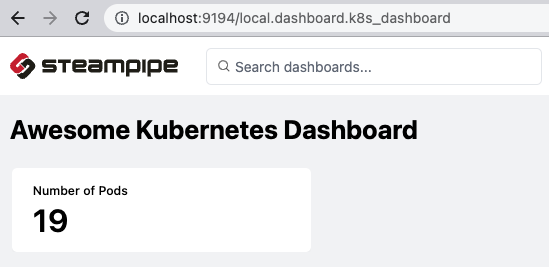
That was easy, but not very visual yet. I think we can do be better with little additional effort.
Enhancing the Dashboard#
Let’s add couple more things to play with the dashboard, you can leave the steampipe dashboard command running in the background and open up the file for editing, the dashboard will automatically reload.
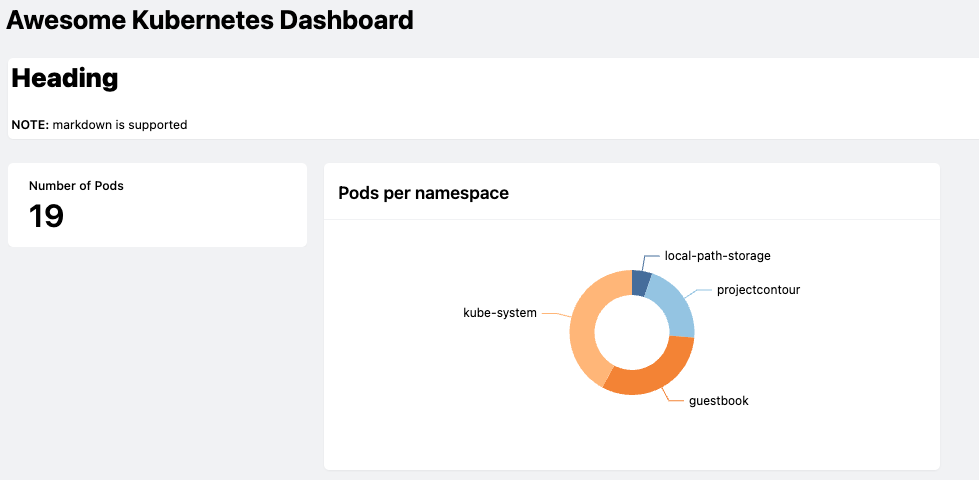
Let’s add a donut chart that show the number of pods grouped by namespace:
 1  chart {
 2    type = "donut"
 3    title = "Pods per namespace"
 4    width = 6
 5
 6    sql = <<-EOQ
 7      select
 8        namespace as Namespace,
 9        count(name) as Total
10      from
11        kubernetes_pod
12      group by
13        namespace
14      order by
15        Total
16    EOQ
17  }
We can also add text and by default Steampipe supports markdown:
1  text {
2    value = <<-EOM
3      # Heading
4
5      **NOTE:** markdown is supported
6    EOM
7  }
Note that both the chart and the text resources should be inside the dashboard resource. Here’s how the file should look so far:
 1dashboard "k8s_dashboard" {
 2  title = "Awesome Kubernetes Dashboard"
 3
 4  tags = {
 5    type = "Dashboard"
 6  }
 7
 8  text {
 9    value = <<-EOM
10      # Heading
11
12      **NOTE:** markdown is supported
13    EOM
14  }
15
16  card {
17    sql = <<-EOQ
18      select
19        count(name) as value,
20        'Number of Pods' as label
21      from
22        kubernetes_pod;
23    EOQ
24    width = 3
25  }
26
27  chart {
28    type = "donut"
29    title = "Pods per namespace"
30    width = 6
31
32    sql = <<-EOQ
33      select
34        namespace as Namespace,
35        count(name) as Total
36      from
37        kubernetes_pod
38      group by
39        namespace
40      order by
41        Total
42    EOQ
43  }
44}
And, the dashboard should look like this now:
Let’s also add the query from before to find all the pods using the legacy container registry, for this we will create a card and a table. Idea is that the card will provide us visibility with a quick glance if we’re affected, to make this really pop we will set the type column to alert if the count of pods is not 0:
 1query "pods_using_legacy_registry_card" {
 2  sql = <<-EOQ
 3    select
 4      count(name) as value,
 5      'Pods Using Legacy Registry' as label,
 6      case count(name) when 0 then 'ok' else 'alert' end as type
 7    from
 8      kubernetes_pod,
 9      jsonb_array_elements(containers) as c
10    where
11      c ->> 'image' like 'k8s.gcr.io/%'
12  EOQ
13}
Setting the type to alert has the effect of making the card red. You should also note that the above resource is a query resource instead of a card or a table . Using query resources helps to keep the file a bit more organised.
Also note that the query resource should not be placed inside the dashboard resource.
Instead of writing the query inline like previously, we can refer to a query resource in a card inside a dashboard like this:
1  card {
2    query = query.pods_using_legacy_registry_card
3    width = 3
4  }
You can also refer to queries across different files etc. allowing some level of re-use, but not across different types of visualisations since the queries will be bit different. That is why for a table we will define another query:
 1query "pods_using_legacy_registry_table" {
 2  sql = <<-EOQ
 3    select
 4      name as Name,
 5      namespace as Namespace,
 6      c ->> 'image' as Image
 7    from
 8      kubernetes_pod,
 9      jsonb_array_elements(containers) as c
10    where
11      c ->> 'image' like 'k8s.gcr.io/%'
12  EOQ
13}
And then a table that references the query:
1  table {
2    query = query.pods_using_legacy_registry_table
3  }
It’s probably good to add a text resource too as a separator, to be placed above the new resources:
1  text {
2    value = <<-EOM
3      # Containers using k8s.gcr.io
4    EOM
5  }
We can append the new text, card and table to the dashboard like this for example:
 1dashboard "k8s_dashboard" {
 2  title = "Awesome Kubernetes Dashboard"
 3
 4  tags = {
 5    ...
 6  }
 7
 8  text {
 9    ...
10  }
11
12  card {
13    ...
14  }
15
16  chart {
17    type = "donut"
18    title = "Pods per namespace"
19    ...
20  }
21
22  text {
23    value = <<-EOM
24      # Containers using k8s.gcr.io
25    EOM
26  }
27
28  card {
29    query = query.pods_using_legacy_registry_card
30    width = 3
31  }
32
33  table {
34    query = query.pods_using_legacy_registry_table
35  }
36}
37
38query "pods_using_legacy_registry_card" {
39  ...
40}
41
42query "pods_using_legacy_registry_table" {
43  ...
44}
Putting these new pieces together should look something like the below screenshot (scroll a bit further down to find the finalised dashboard):
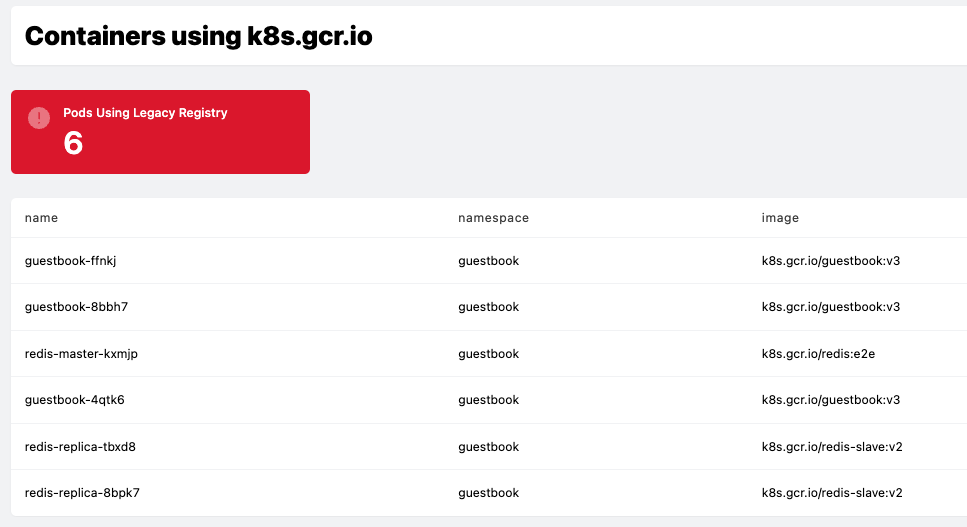
Having the table and card together allows us to immediately drill-down for more information without leaving the browser. This is also a nice way of sharing information to stakeholders that might not have access to the cluster directly.
Putting it together#
Here’s the final dashboard:
 1dashboard "k8s_dashboard" {
 2  title = "Awesome Kubernetes Dashboard"
 3
 4  tags = {
 5    type = "Dashboard"
 6  }
 7
 8  text {
 9    value = <<-EOM
10      # Heading
11
12      **NOTE:** markdown is supported
13    EOM
14  }
15
16  card {
17    sql = <<-EOQ
18      select
19        count(name) as value,
20        'Number of Pods' as label
21      from
22        kubernetes_pod;
23    EOQ
24    width = 3
25  }
26
27  chart {
28    type = "donut"
29    title = "Pods per namespace"
30    width = 6
31
32    sql = <<-EOQ
33      select
34        namespace as Namespace,
35        count(name) as Total
36      from
37        kubernetes_pod
38      group by
39        namespace
40      order by
41        Total
42    EOQ
43  }
44
45  text {
46    value = <<-EOM
47      # Containers using k8s.gcr.io
48    EOM
49  }
50
51  card {
52    query = query.pods_using_legacy_registry_card
53    width = 3
54  }
55
56  table {
57    query = query.pods_using_legacy_registry_table
58  }
59}
60
61query "pods_using_legacy_registry_card" {
62  sql = <<-EOQ
63    select
64      count(name) as value,
65      'Pods Using Legacy Registry' as label,
66      case count(name) when 0 then 'ok' else 'alert' end as type
67    from
68      kubernetes_pod,
69      jsonb_array_elements(containers) as c
70    where
71      c ->> 'image' like 'k8s.gcr.io/%'
72  EOQ
73}
74
75query "pods_using_legacy_registry_table" {
76  sql = <<-EOQ
77    select
78      name as Name,
79      namespace as Namespace,
80      c ->> 'image' as Image
81    from
82      kubernetes_pod,
83      jsonb_array_elements(containers) as c
84    where
85      c ->> 'image' like 'k8s.gcr.io/%'
86  EOQ
87}
Summary#
We’ve only scratched the surface of what is possible with Steampipe in this blog, maybe we will explore more features and plugins in future blog posts. We highly recommend checking out the project. Even if your SQL is rusty, we find it’s quite easy to get things done and after a bit of practice you’ll find yourself writing queries ad-hoc to answer questions that pop up.
If you found something wrong with the content or something felt vague or awesome, leave us a comment! Additionally, if you’d like any help with Steampipe and/or Kubernetes please get in touch!